Need personal help? We reply quickly.
Reach our team directly — we walk new creators through setup.
InkToAudio help center
How to use InkToAudio
A complete, plain-English guide for turning your writing into studio-quality audio and distributing it as a podcast. Every feature is explained step by step — no technical knowledge required.
Analytics
Open Analytics in the sidebar to see how your audience is engaging with your episodes.
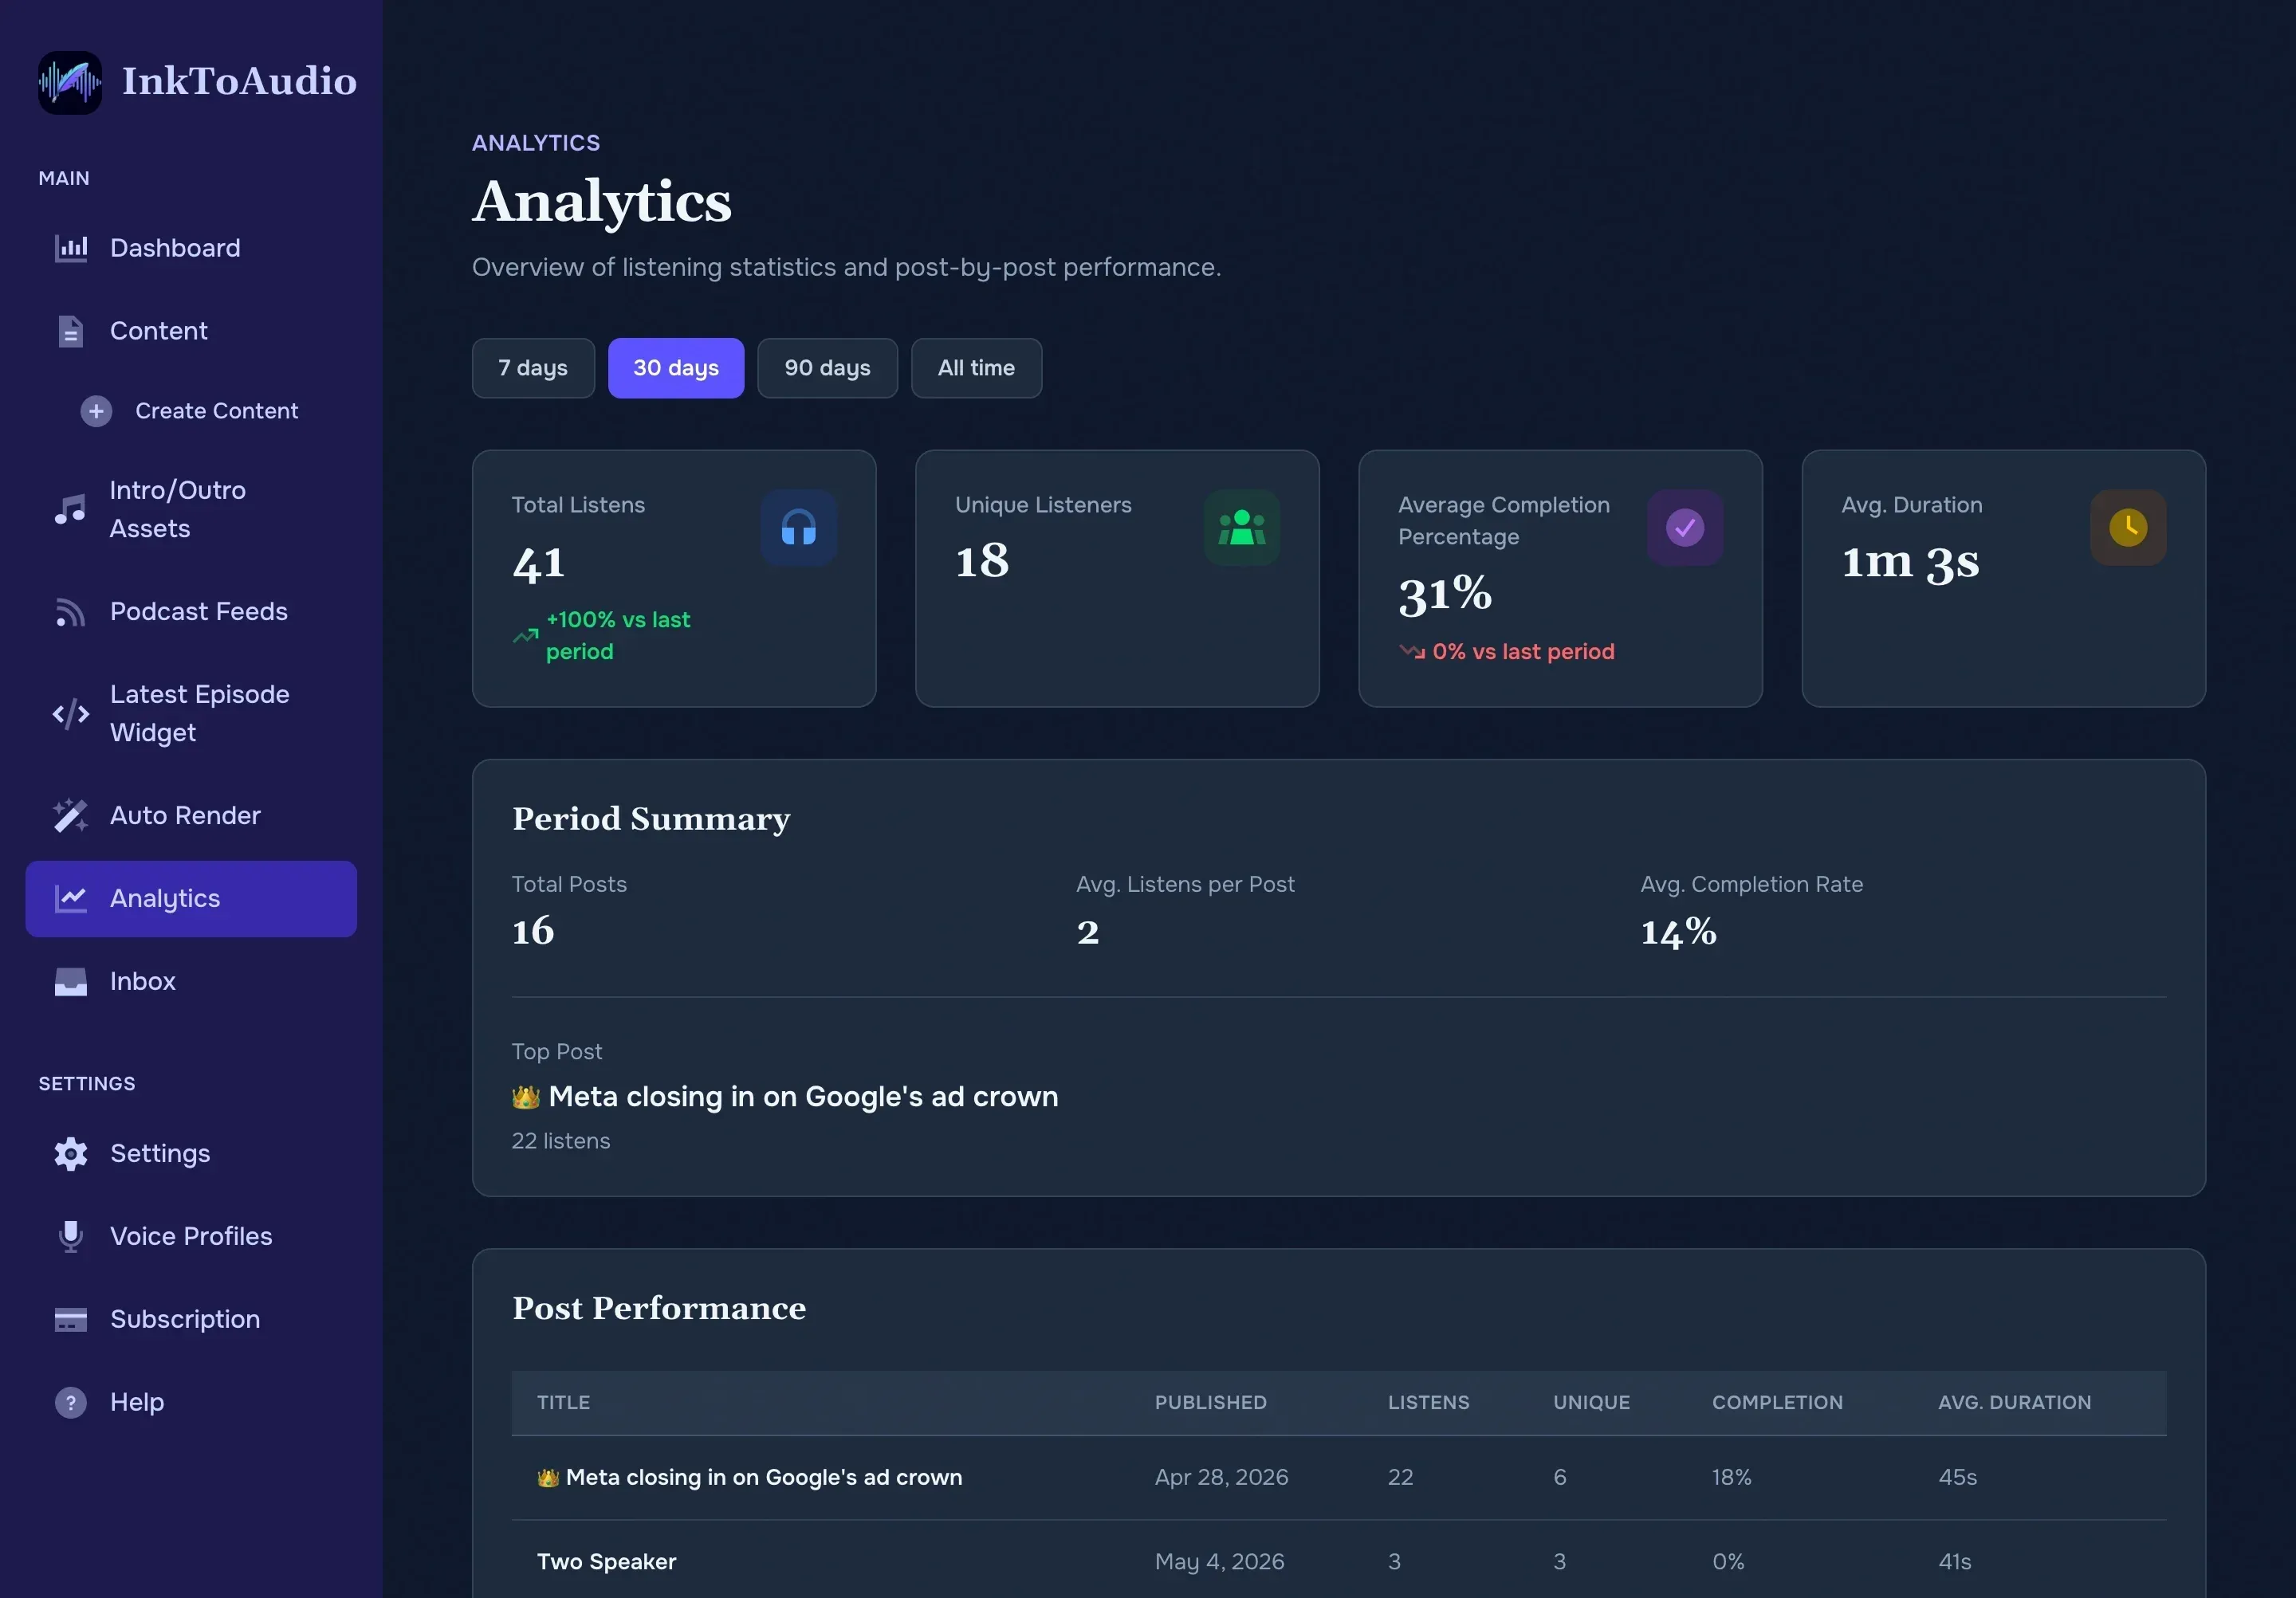
Choosing a time range
Use analytics as a directional newsroom signal, not a perfect census. The four buttons at the top switch the window: 7 days, 30 days, 90 days, or All time. Every number on the page updates to match the selected range.
Overview stat cards
- Total listens — how many times someone pressed play. Includes a growth % versus the previous equal-length period.
- Unique listeners — distinct listeners, not double-counted. Tracked by account when the listener is signed into a free individual account; otherwise tracked by device.
- Average completion % — on average, how much of an episode listeners finish. 60%+ is strong.
- Average duration — average minutes listened per play.
Period summary
- Total posts published in the selected range.
- Average listens per post.
- Average completion rate.
- Top post — title and listen count of your best performer.
Post performance table
Below the summary is a table of every post published in the range, with columns for Title, Published, Listens, Unique, Completion, and Avg. duration. Click any column header to sort by it.
Tip